Put care
within reach.
Not just on the map.
CareGap measures who can actually reach suitable care, simulates new clinics and mobile units, and ranks the locations that improve access for the communities still left outside.
Access scanner
Scanning the study area
Computing nearest suitable facility travel times for every population area.
Baseline
Nearest suitable facility
Service suitability is part of the calculation.
Intervention
Additive simulation
Existing facilities remain; new ones are recalculated.
Ranking
Greedy + equity-weighted
A documented heuristic, never sold as optimal.
Evidence
Deterministic, auditable
Every displayed number traces to the analysis API.
A mapped clinic is an input.
Reachable care is the outcome
the model can interrogate.
A facility on the map is not the same as care within reach.
The nearest option may not offer the right service. A road may add forty minutes. A population area may be counted as covered without anyone asking who lives there. CareGap makes those distinctions explicit, then lets planners test what changes if a new resource appears.
From baseline to a defensible shortlist.
CareGap is not a static dashboard. The map, scenario results, and recommendation explanations all use the same spatial analysis. Change a threshold or move a proposed facility and the supported values change with it.
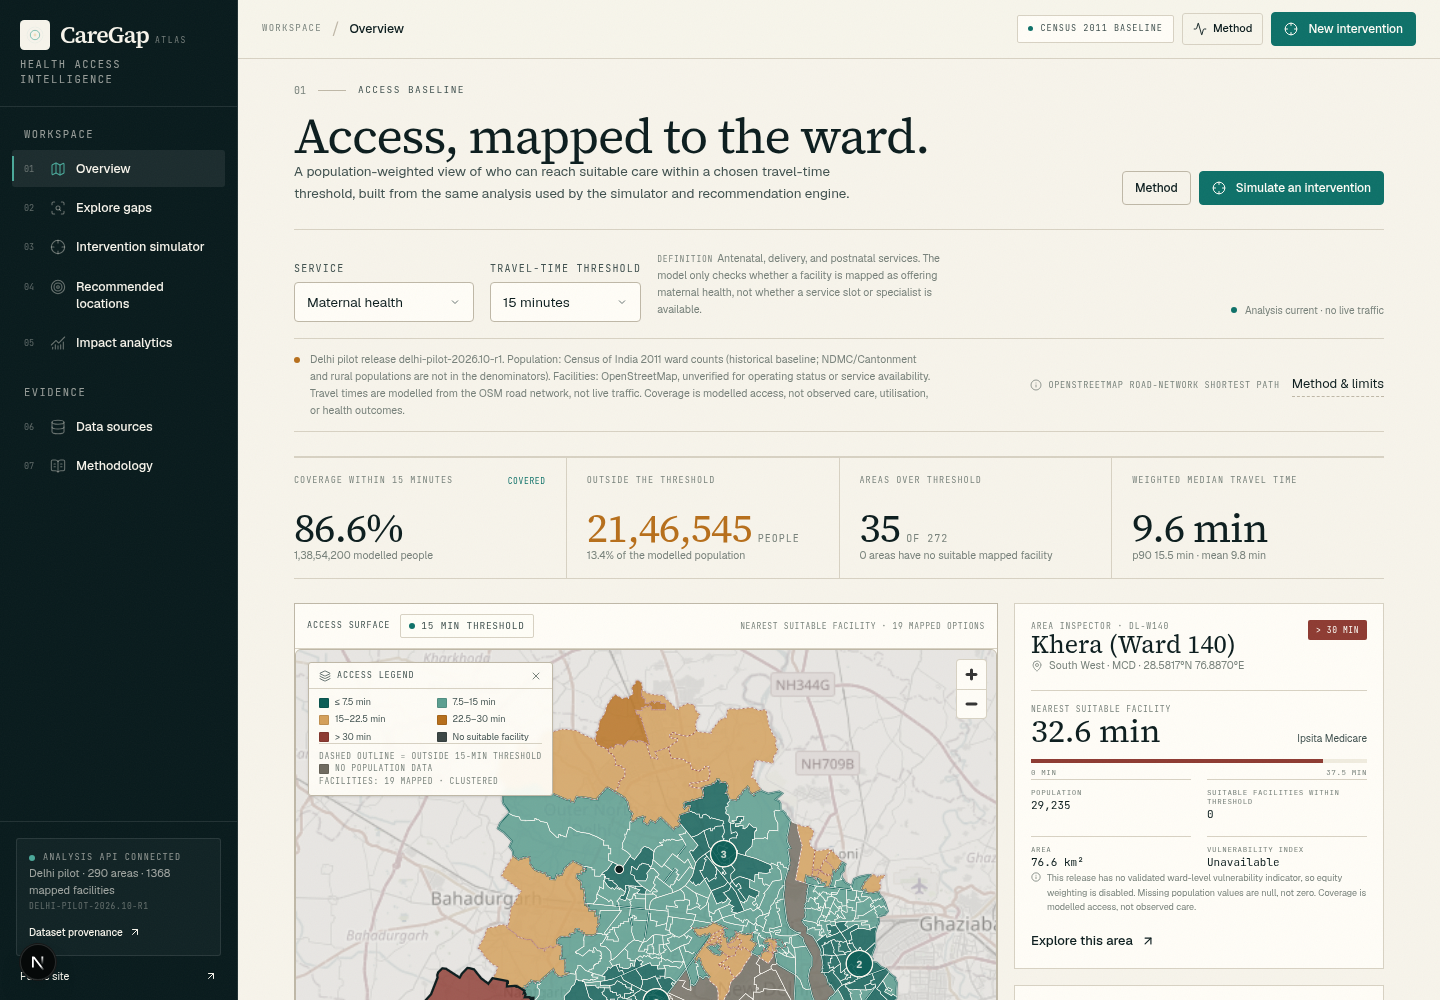
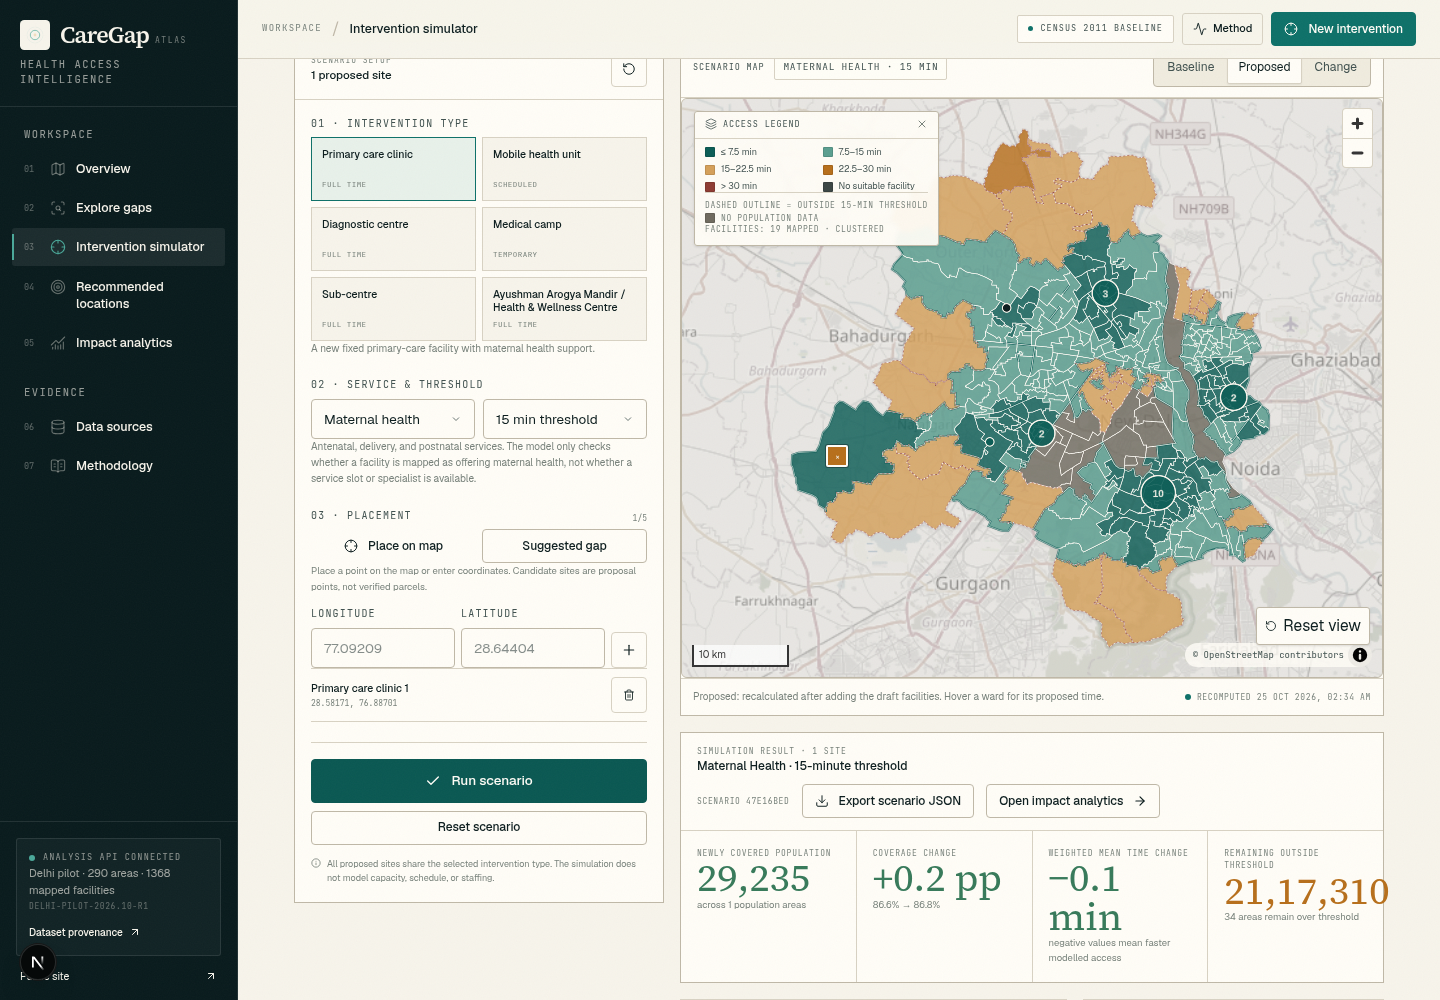
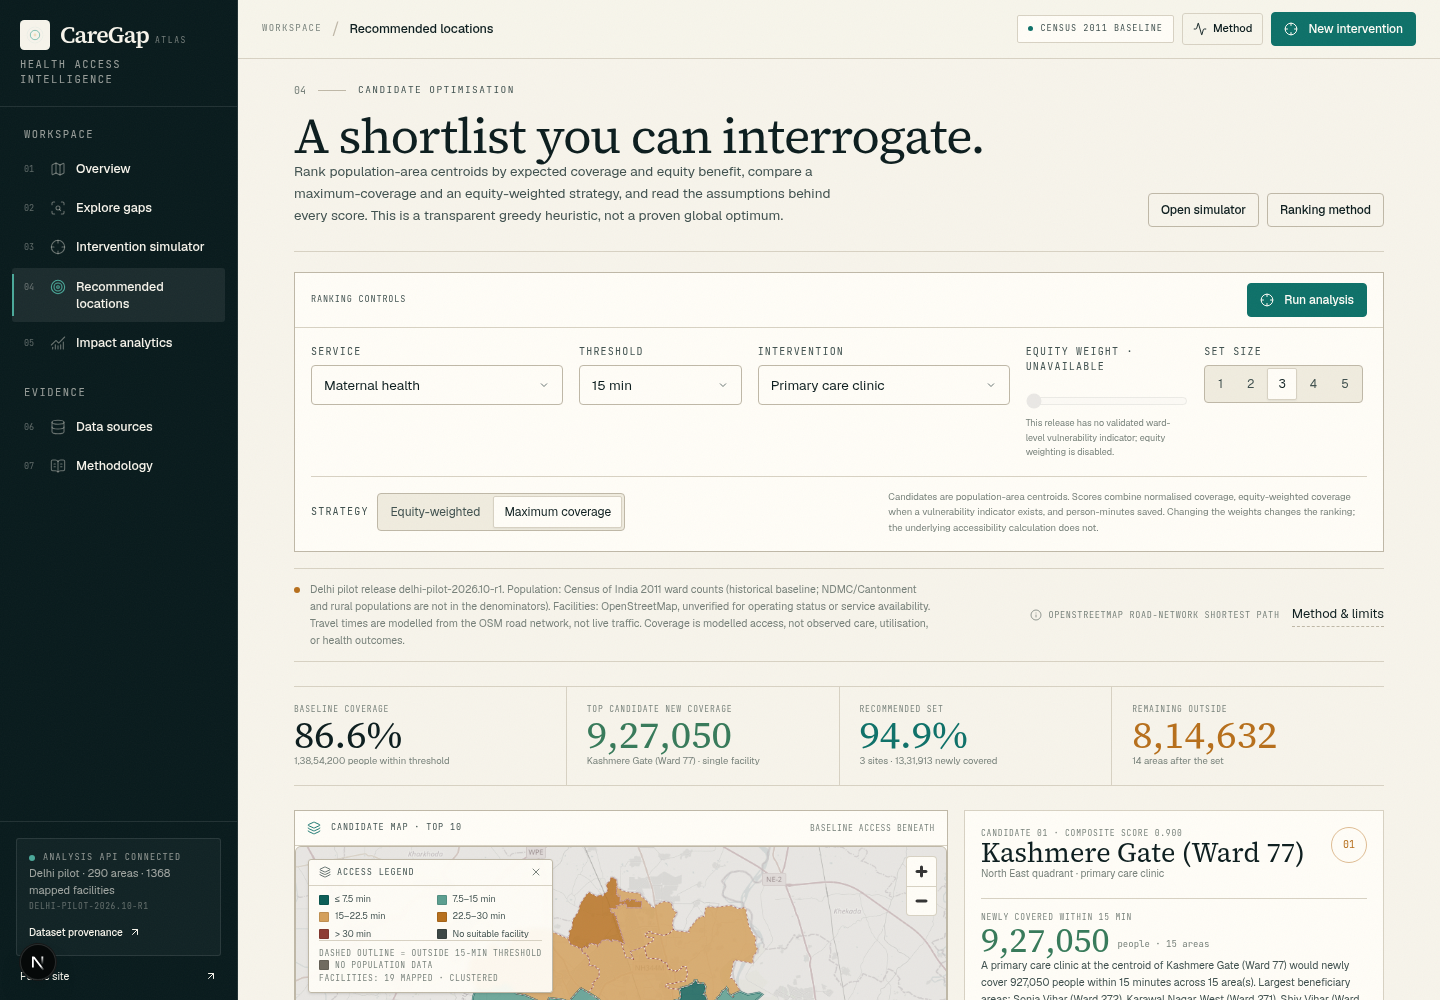
Captured from the running workspace. Values are computed by the analysis API; screenshots are not decorative mockups.
Move the pin.
Recompute the district.
The simulator is the centre of the product. It adds a proposed facility to the network, re-runs accessibility for every population area, and compares coverage, travel times, and equity against the baseline.
Input
Location, type, service
Method
Nearest suitable facility
Output
Newly covered people
The sample is computed live from the local analysis API. Candidate sites are population-area centroids; the ranking is a greedy heuristic and not a global optimum.
A useful model states what it cannot see.
CareGap separates measured geography from operational reality. This ledger is part of the product, not small print: coverage is a travel-time proxy, not proof that a service is staffed, available, affordable, or good.
Dataset
CareGap dataset
- Release
- —
- Population
- Synthetic
- Boundary
- Synthetic district
- API
- —
Population denominator
Area-level synthetic population only; no individual records.
Mapped facilities
Fictional facility inventory with mapped service tags.
Travel time
Road-network shortest paths
Coverage definition
Nearest mapped facility offering the selected service, within the threshold
Capacity, staffing, queues
Not represented. Faster travel does not guarantee treatment.
Opening hours, cost, quality
Not represented. Access is not the same as effective or respectful care.
Health outcomes & causality
No outcome claim. The model measures modelled access, not health improvement.
Live traffic
No live feeds. The demo road network is synthetic.
Patient-identifiable data
None collected or required. The dataset is area-level and synthetic.
Missing facilities in the mapped inventory are not evidence that care is absent. Data completeness is a first-order limitation of any accessibility map.
Read the full methodPublic-health responsibility
Coverage is not care.
A score is not a decision.
What the engine supports
Comparing modelled access, finding candidate sites, understanding trade-offs, and asking better questions before resources are committed.
What it cannot do
Verify that a service is available, staffed, affordable, or clinically appropriate. Those require operational and community evidence beyond this model.
No PHI · No clinical claims
Census 2011 · OpenStreetMap · modelled travel
Start with the Delhi pilot
The next clinic
already has an address.
Open the workspace, inspect the gaps, place a proposed resource, and see the study area recalculate. The population and map sources are public and dated; the calculations are reproducible.